Weight-Based Honey Yield Optimization
The Science of Bee Colony Weight and Honey Production
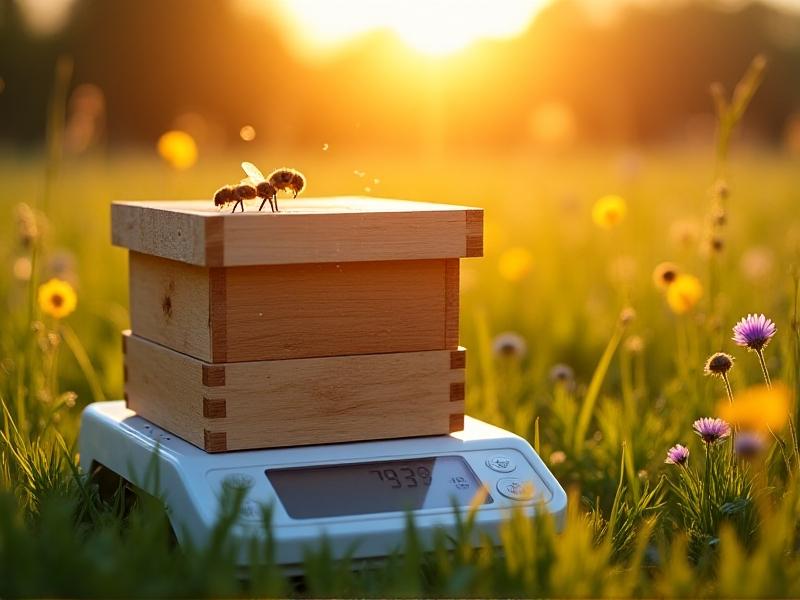
Honey yield optimization begins with understanding the relationship between hive weight and productivity. A colony’s weight fluctuates based on factors like nectar intake, brood production, and stored honey. Heavier hives often indicate robust foraging activity and sufficient food reserves, while sudden weight loss may signal swarming, pests, or resource scarcity. Modern beekeepers use precision scales to track these changes, correlating weight data with environmental conditions like bloom cycles and weather patterns. By analyzing trends, they can predict honey flows and intervene proactively to maximize yields.
Advanced Tools for Monitoring Hive Weight
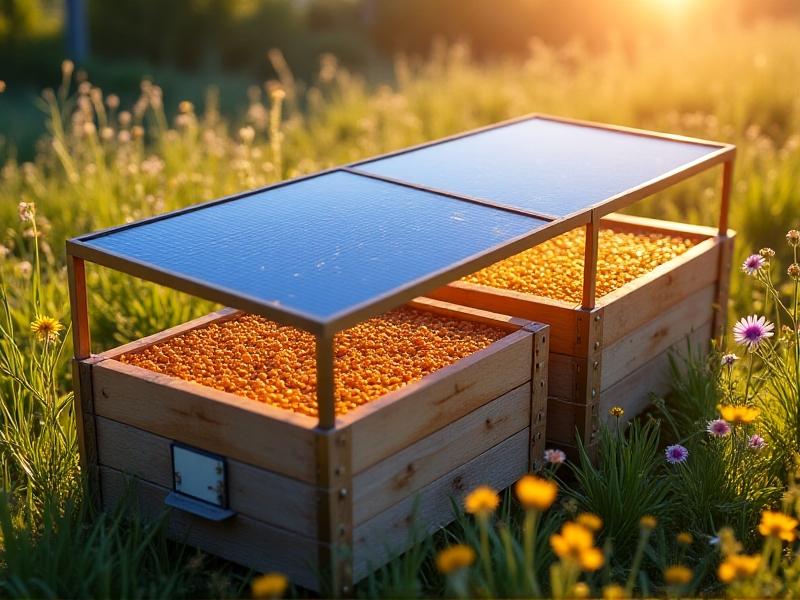
Gone are the days of manual hive lifting. Today’s apiaries employ IoT-enabled scales that transmit real-time weight data to cloud platforms. These devices measure increments as small as 100 grams, detecting nectar influxes overnight. Some systems integrate weather sensors, linking weight spikes to rainstorms or temperature drops. For example, the HiveTrack S5 provides hourly reports via smartphone apps, alerting beekeepers to abnormal trends. Paired with infrared hive cameras, these tools offer unparalleled insight into colony behavior, enabling precise feeding schedules or swarm prevention measures.

Decoding Weight Data: From Numbers to Action
Raw weight metrics mean little without context. A 2 kg gain in spring could represent brood expansion, while the same increase in fall might indicate excess honey stores. Successful analysis requires cross-referencing data points: beekeepers compare daily weight changes against local flora bloom calendars and historical yield records. Machine learning platforms like ApiaryAI now automate this process, flagging when a hive’s weight plateaus during peak clover season—a sign to add supers or relocate colonies to richer forage zones.

Strategic Hive Management Based on Weight Metrics
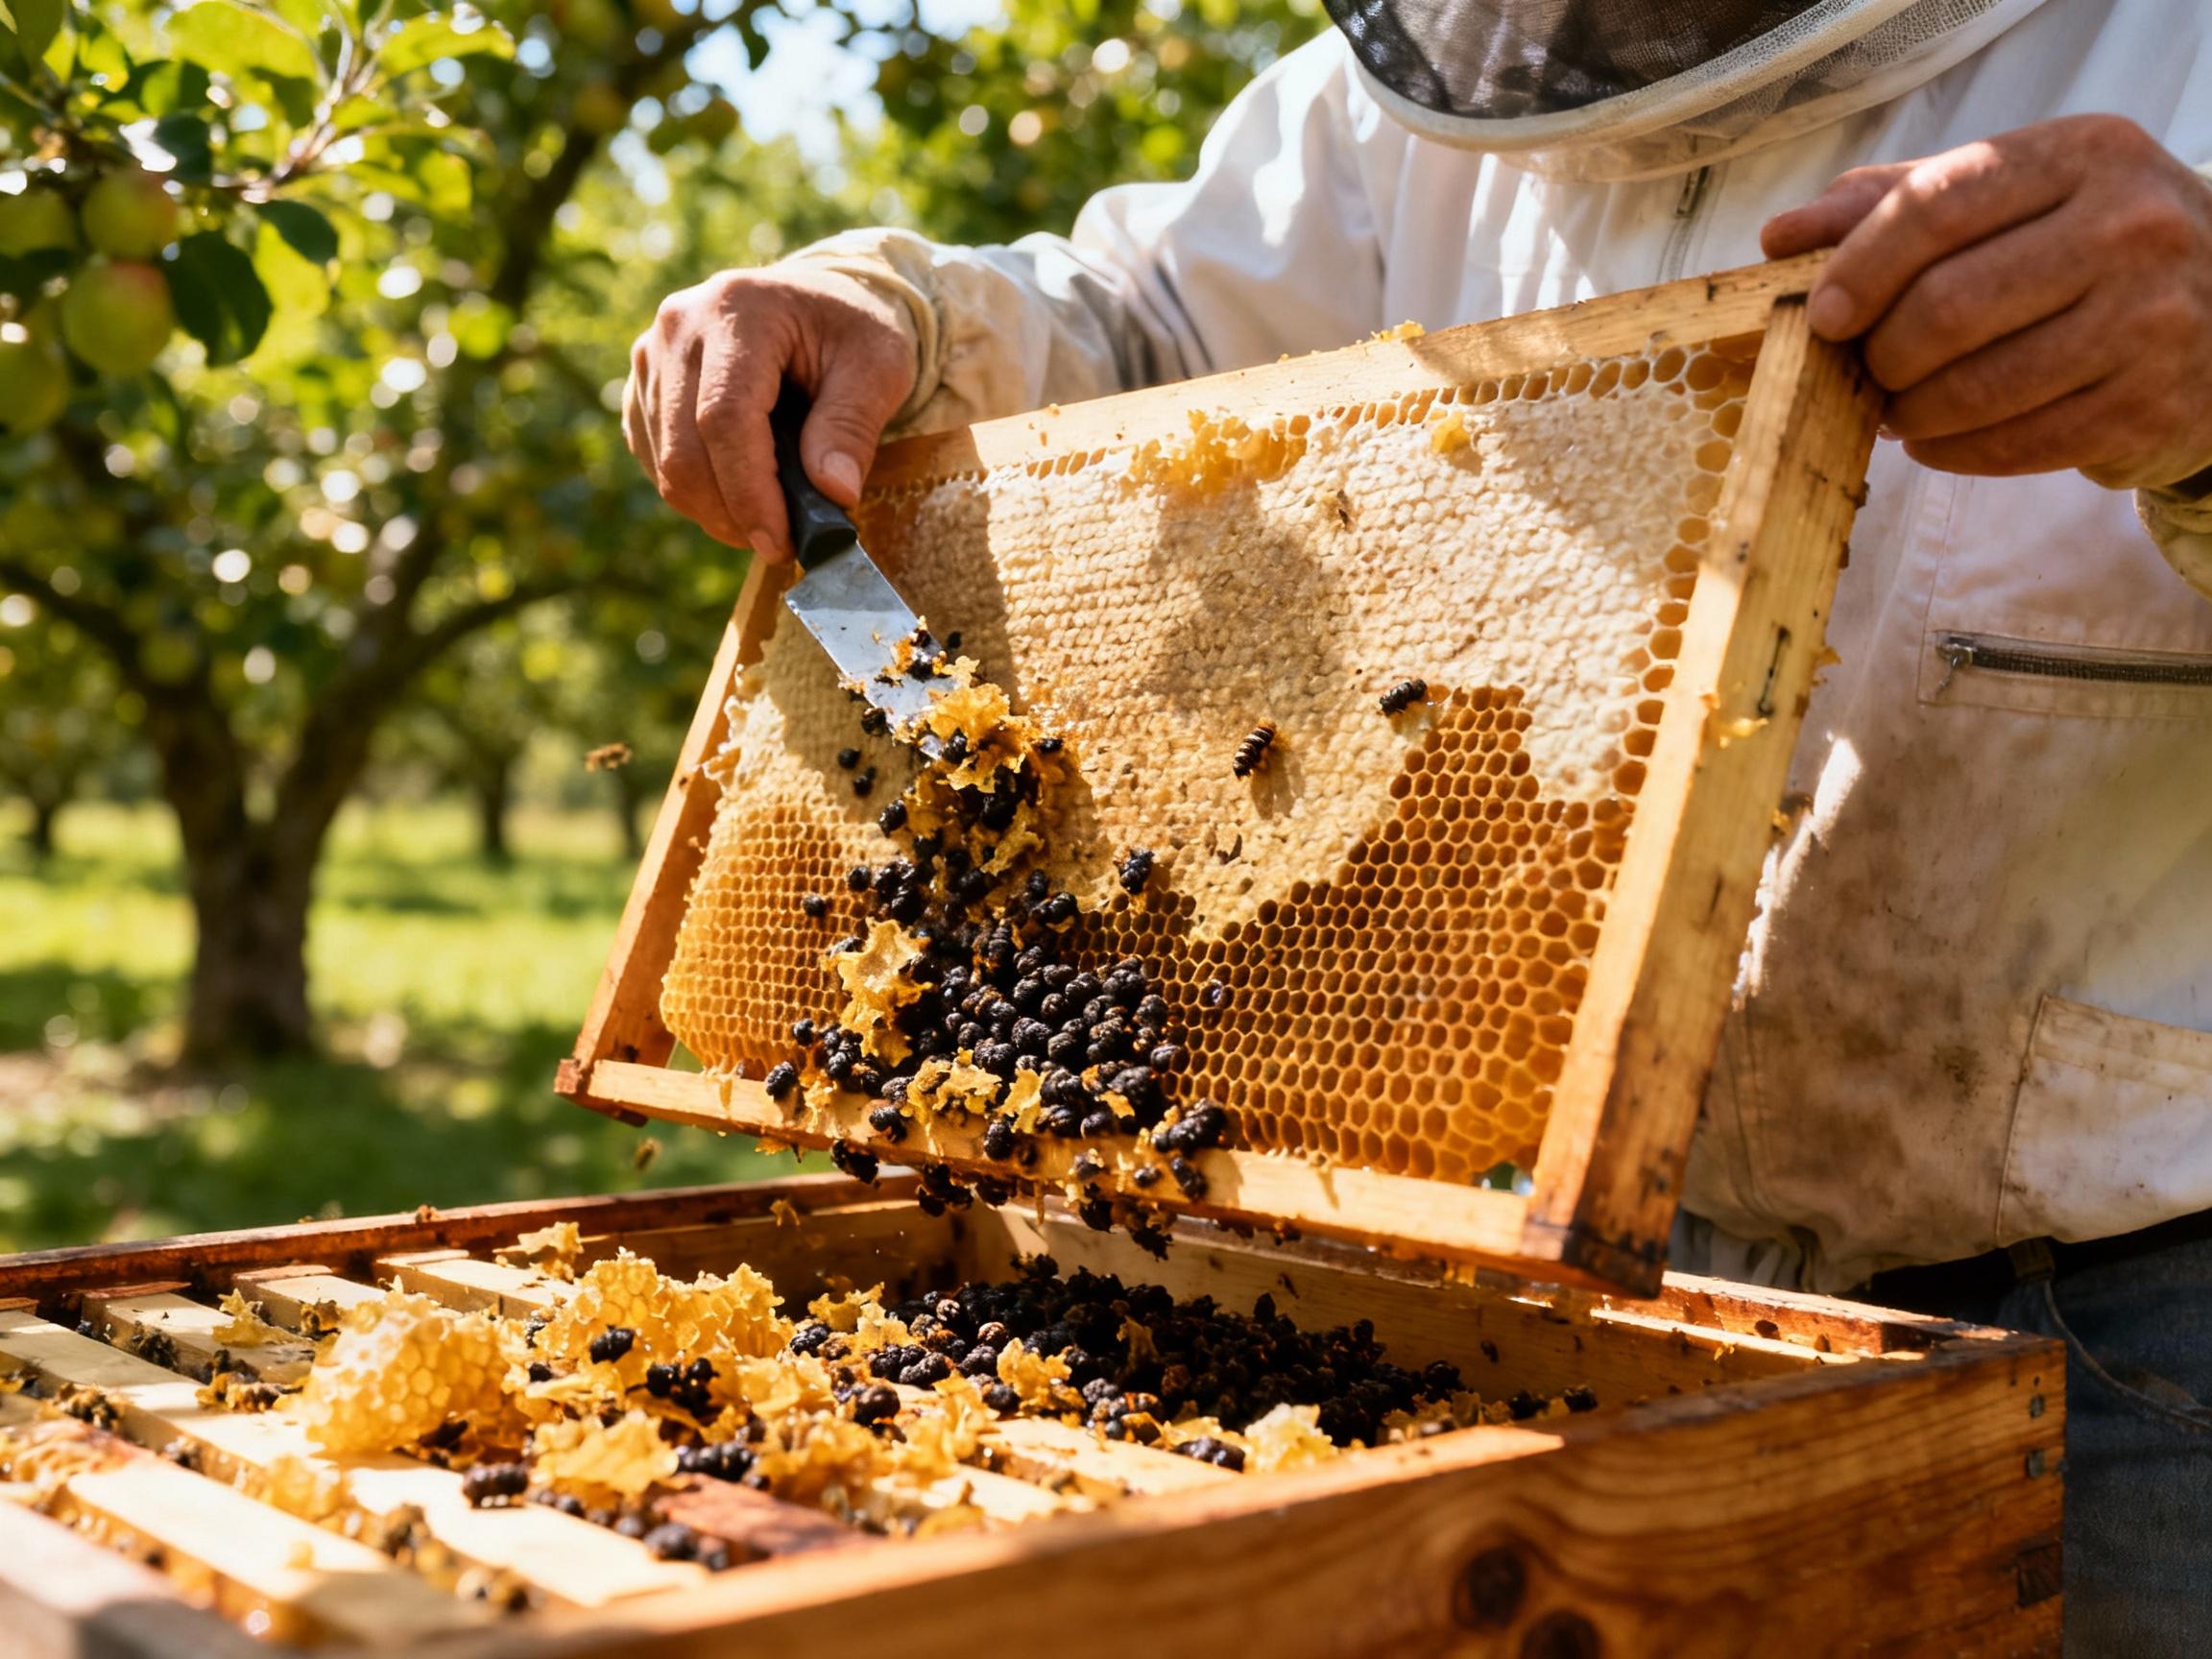
Weight data transforms passive observation into targeted action. When scales detect sluggish spring weight gain, beekeepers might supplement with protein patties to boost brood rearing. Conversely, rapid midseason weight loss triggers inspections for varroa mites. During honey flows, a steady 0.5 kg nightly increase signals prime conditions for adding honey supers. Maine beekeeper Emma Reyes credits weight-based strategies for boosting her average yield from 27 kg to 41 kg per hive: “The scales told me exactly when my bees needed space versus when they were stressed by mites.”

Seasonal Weight Patterns and Honey Flow Forecasting
Hive weight cycles mirror nature’s rhythms. In temperate regions, colonies typically lose 15-20% weight during winter, then gain 1-3 kg weekly as fruit trees bloom. Desert apiaries show bimodal patterns—spring mesquite flows and fall desert wildflower spikes. By archiving annual weight data, beekeepers create predictive models. The Utah Beekeepers Association’s 2025 study found colonies reaching 45 kg by July 1st produced 32% more honey than lighter hives, revolutionizing how members time migratory beekeeping routes.
Case Study: Doubling Yield Through Weight Optimization
Brazilian beekeeper Carlos Mendes transformed his 200-hive operation using weight analytics. By correlating hive weight with eucalyptus bloom intensity maps, he fine-tuned transportation routes between São Paulo and Minas Gerais. Real-time scales revealed optimal honey harvest windows—when nightly weight gains slowed below 200 grams, indicating capped honey. This strategy cut premature harvesting by 70%, increasing his total yield from 8 tons to 15.6 tons annually. Mendes’ cost-benefit analysis shows the system paid for itself in 14 months through reduced labor and higher-quality exports.
Overcoming Challenges in Weight-Based Beekeeping
While powerful, weight tracking poses unique hurdles. Initial costs deter small-scale keepers—a full monitoring kit often exceeds $300 per hive. Data interpretation requires training; a 2026 Cornell study found 61% of new users misread weight loss during natural brood reduction cycles. Solutions are emerging: cooperative equipment-sharing programs and AI-powered apps like HiveMind now explain weight anomalies in plain language. Texas A&M’s Beekeeping 101 course added mandatory weight analysis modules, reducing user errors by 44% among graduates.
Future Innovations: AI and Predictive Weight Modeling
The next frontier combines weight data with predictive algorithms. Startups like ApisTech are testing systems that forecast hive weights 14 days ahead using weather models and satellite vegetation indices. Early adopters receive alerts like: “Move hives 80 km northeast in 3 days to capitalize on linden tree bloom.” Experimental projects even propose drone scales for remote wilderness apiaries. As these tools evolve, they’ll empower beekeepers to sustain colonies through climate shifts while meeting rising global honey demand.